Trying to run a successful digital marketing program without optimizing your conversion rate is like a doctor trying to treat their patient without running tests to see what’s wrong. Conversion Rate Optimization is a key to success. It requires a business to gain an understanding of many aspects of their website, and understand where it is effective and where there are revenue leaks. However, getting started can be intimidating. One of the biggest mistakes committed is for businesses to get overwhelmed by the sheer number of conversion optimization tools available and then opt out. Don’t let that happen to you!
In this article, we’re going to go over 9 different reports that are useful when doing conversion optimization, and which are recommended by industry professionals. Each of them is unique and has its own benefits. We will go over the benefits, uses, and implementation steps for each report. Let’s get to it…
Landing page
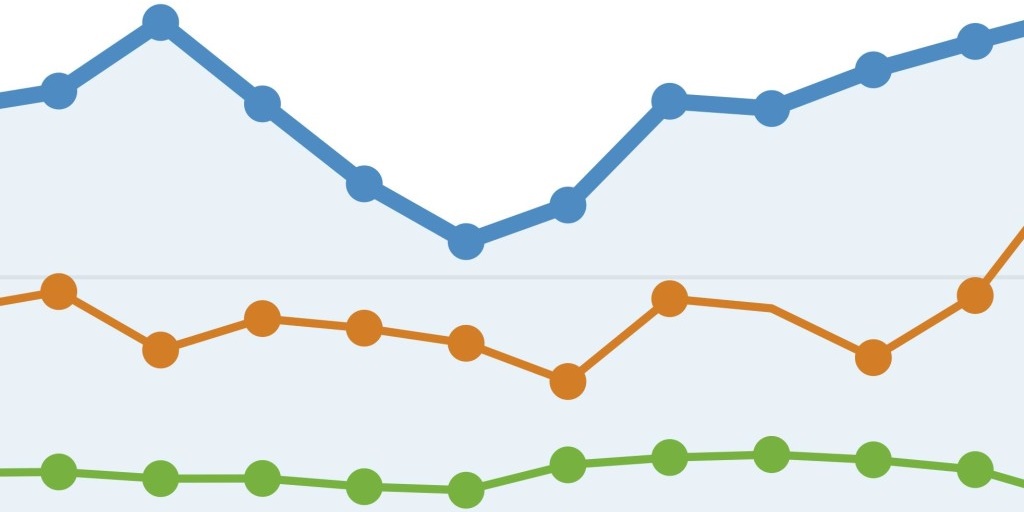
The landing page report is a pretty simple resource that can be found in Google Analytics. Its main function is to determine how well your pages are doing, which ones are showing a good conversion rates and which are under performing. You can access the landing page report in Google Analytics under Behavior > Site content > Landing pages. There, you’ll find a detailed breakdown of the traffic information of all your pages, including information such as:
- “Compare to site average” enables you to see how a page is performing compared to other pages on your site.
- The average conversion rate for your entire site.
- Bounce rate per page, which is the number of website visitors who navigate away from the site after viewing only one page.
Pages that display a combination of a high bounce rate and low conversion rate are the pages that you’ll want to start investigating further straight away to see if you can improve their numbers. This kind of report is particularly useful for sites where conversion opportunities are more diffused, rather than on a site where they are centralized, such as an online store.
Funnel Visualization
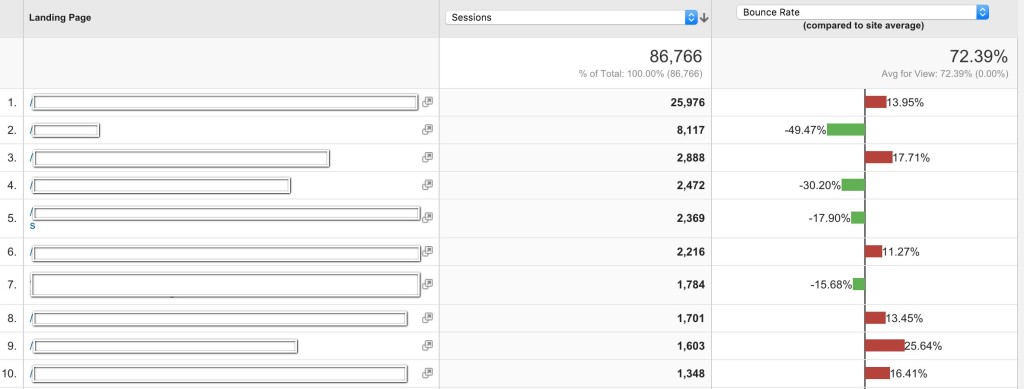
A goal funnel is a report in Google Analytics that shows the effectiveness of a particular sales funnel. A sales funnel relates to the journey a visitor is taken through on the site, from the first moment they visit your site until the completion of the sale. Setting up this report can be a little involved, but the findings can be useful enough to justify this investment of time. Here’s how to get started:
- Under the Admin section of your Google Analytics account, choose the correct Account, Property, and View.
- Click Goals under the View section.
- Select the New Goal button and then choose “Place an order” on the next screen.
- Next, give the goal a name, choose an available Goal ID slot, and a type of goal.
- When that’s finished, hit Continue.
- Finally, specify the location of your Thank You page and turn the Funnel tumbler on. You will need to specify the URL for each step of the sales funnel (for example Category page, Product page, Cart, Shipping and Billing info, Payment).
You can find this report by going to Conversions> Goals > Funnel Visualization.
Sales funnels will actually show your customers as they go through each one of checkout steps, show you points along the way where different customers drop off, and give you the ability to go back and optimize those pages to increase your conversion rates.
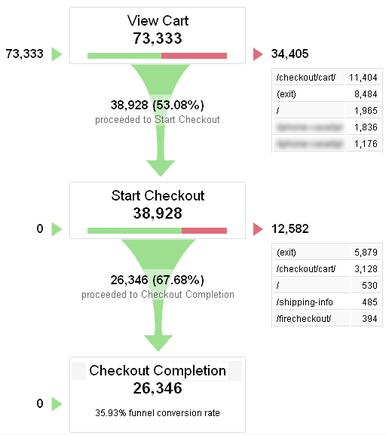
Site search
The site search report is one of the simplest reports out there, based on the data from your site search. When you have this feature installed you can monitor your customers’ searches to see what people are looking for, how they search, and other useful information. Here’s how you find it:
- Under the Google Analytics Admin section, click “View Settings”
- Then turn on the option that allows site search tracking
- This will then create reports on customer searching, you can find these reports under:
- Behavior > Site Search > Search Terms
Behavior > Site Search > Usage
Behavior > Site Search > Pages
As a result, you will have quite a bit of data regarding what customers are looking for, how quickly they’re able to find it, and whether there are sections of your site that you can improve to improve your visitor experience.
Browsers
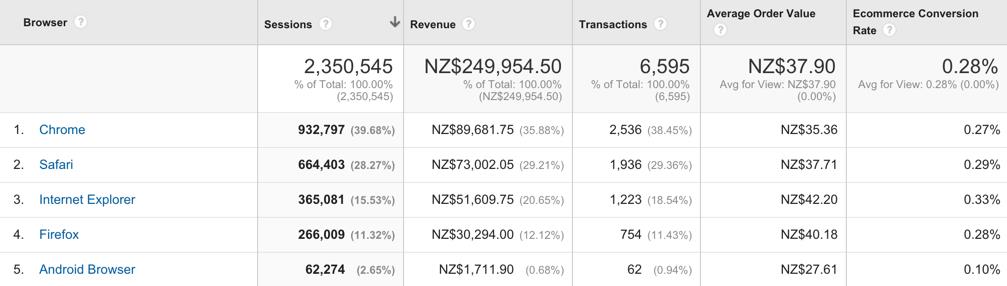
Low performing browsers can be a big challenge when trying to optimize a site. After all, when customers are frustrated with the technical aspects of a website, such as it being very slow or not displaying content properly, they’ll often leave and look elsewhere. Due to technical reasons, your website may display differently on the various browsers out there. To that end, optimizing websites so that they work across different browsers is very important. You can see Google Analytics’ report on browser performance by going to Audience > Technology > Browser & OS. There, you can break the results down by conversions per browser.
Once you discover which browser is under performing, you can start optimizing you site for these different browsers.
Audience demographics report
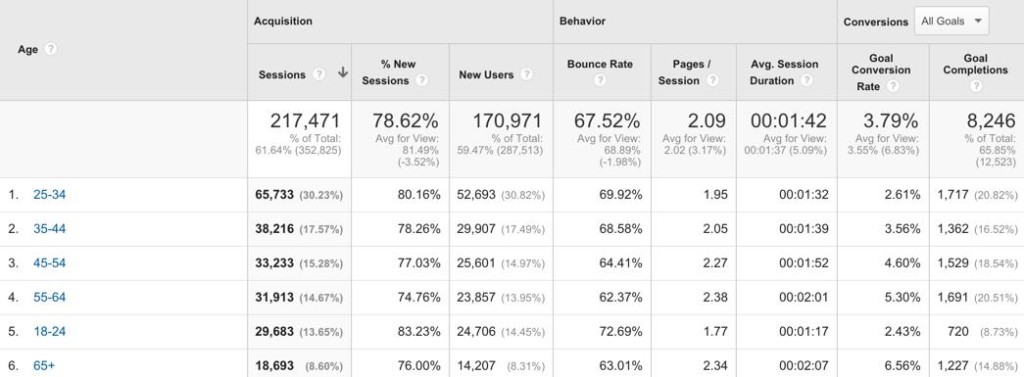
Demographic research is a pretty foundational part of digital marketing and CRO. When you’ve set up your audience “demographics feature” you can find the reports it generates, for instance in terms of age, under Audience > Demographics > Age.
This will let you see the breakdown of people on your website separated by age. The report also features other types of demographic breakdowns so that you can take a closer look at how you might want to market your site to these specific groups.
Mobile traffic
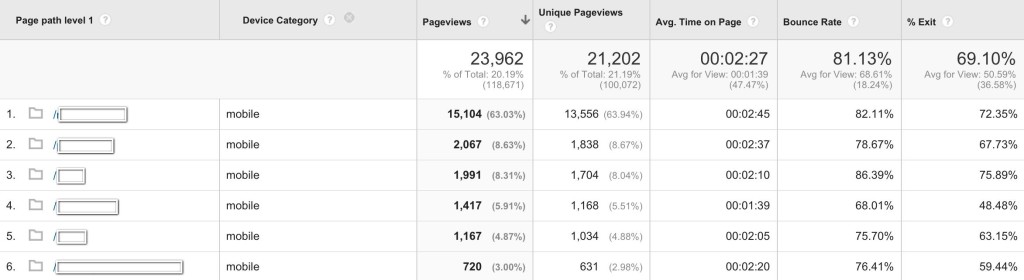
Optimising for mobile traffic is, understandably, an important topic now that so many people have smart phones and tablets. You can find mobile traffic breakdowns in Google Analytics under Behavior > Site Content > Content Drilldown. Under this tab, add “device category” as a secondary search dimension. Then apply an advanced filter to “include bounce rate greater than 65” and “Device category containing mobile.’’ This will filter page views and bounce rates based on the user’s device.
The report will let you see whether you have pages on your site that are particularly unfriendly for mobile devices.
The check out
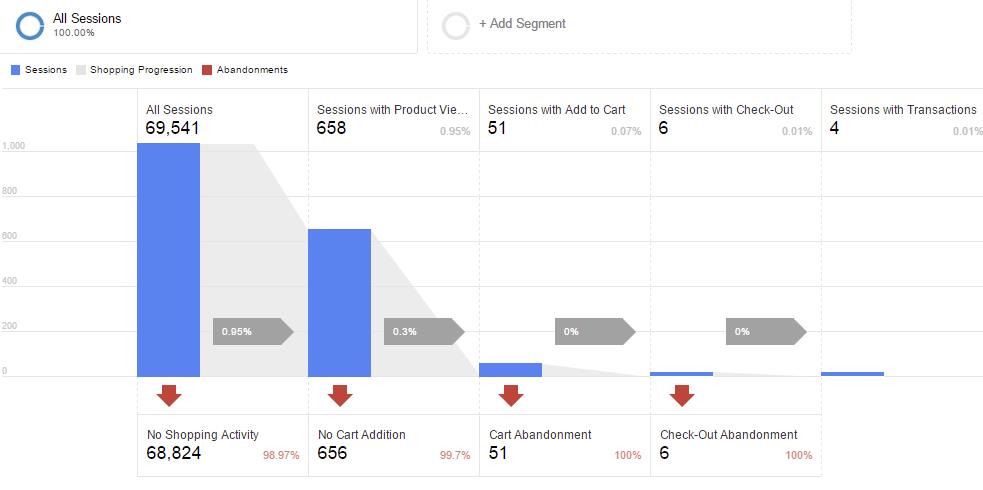
One of the most important steps in the buying process for ecommerce sites is the check-out page. Optimizing this part of your site is very important in order to successfully complete conversions and actually make sales. After all, if your customers are frustrated with the process of buying a product, they might abandon the sale. The check-out report is part of the “Enhanced Ecommerce” in Google Analytics. You can view your checkout behavior analysis under Conversions > Ecommerce >Shopping Analysis > Checkout Behavior Analysis.
This report will show you where drop offs in customer conversion are occurring, which will then give you a better insight in how to fix them.
Tip. In case you don’t have an Enhanced Ecommerce implementation in place, we suggest using Funnel Visualization report for that matter. We have showed how to set this up in paragraph 2.
Screen resolution
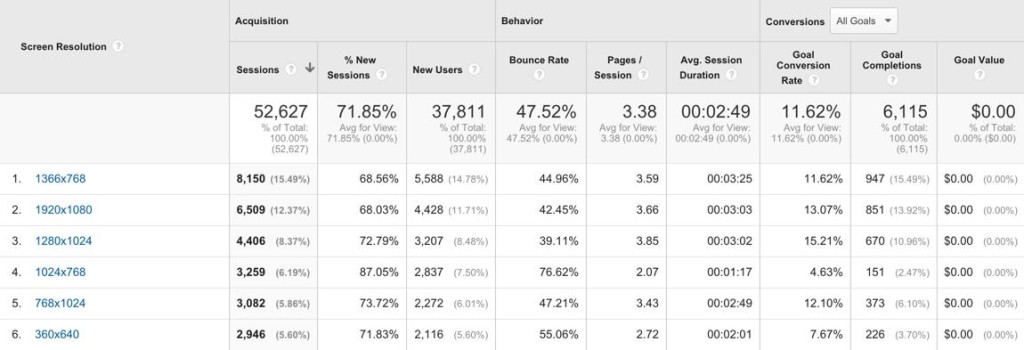
Optimizing your site for different screen resolutions is getting more and more important to pay attention to, as the number of different screen sizes keeps increasing. Under Audience > Technology > Browser & OS, set the primary analytic dimension to “Screen Resolution.”
This will show you whether any of the pages are set at a resolution that is generating low conversion rates and very high bounce rates.
Behavior flow
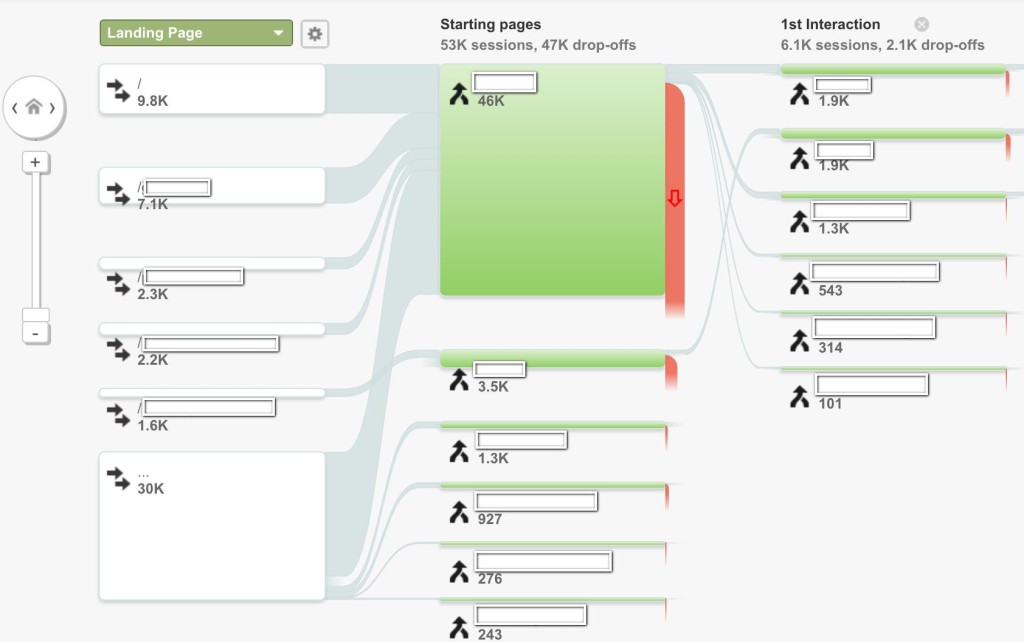
You can access your behavior flow reports from Behavior > Behavior Flow, which will show you how your visitors flow through your website. Technically this is a bit harder to set up, however there is a number of methods you can use to simplify your data, such as:
- highlighting traffic areas
- setting specific groups
- exploring specific traffic.
These analytics will give you an idea of how people are moving on and through your website, and it can highlight problem areas you might not have found in other, more targeted reports.
Conclusion
Utilizing these 9 reports will help you understand your visitor behavior a lot better. You’ll get an insight into what may be stopping them from buying, which parts of your site are underperforming and what your visitors are looking for. The exciting thing is that this valuable information is available in your Google Analytics account, ready for you to benefit from, as long as you know how. We hope this post will have given you a better insight and will encourage you to utilize these reports better to increase your conversion rates.